Running a brewery is a balance of art, science, and business. While crafting a great beer is at the heart of it all, long-term success comes down to smart decision-making backed by real, timely data. Like any business, if you’re not making money, you’re not going to last. Two of the most important metrics every brewery should be actively tracking are Sales and COGS (Cost of Goods Sold). When you understand how much you're selling and what it's costing you to make each pint, you unlock the power to optimize your margins, scale smarter, and run a healthier operation overall.
Sales figures are more than just numbers; they tell a story and let you know what’s resonating with your customers at what times of year, where you're growing, and which parts of your business need attention.
By tracking sales broken down by brand and brand type, you can see exactly which beers are driving revenue. This insight helps you prioritize production, dial in your marketing efforts, and make sure your flagship beers are performing as expected. If you analyze performance by format, such as cans, bottles, or kegs, you can understand packaging preferences and align your production accordingly.
If your brewery has sales reps in the market, being able to view their individual performance can help you identify who’s excelling and who might need support. And for those distributing across multiple locations or taprooms, seeing sales data by city or market ensures you’re targeting the right areas and responding to real trends in real time.
It’s a lot of data to take in, but if you manage it correctly, it can tell you exactly what your next move should be.
On the flip side of the equation is your COGS. While sales are incredibly important, even a wildly popular beer can drain your bottom line if it’s not cost-effective to produce.
Tracking actual vs. target COGS allows you to spot problems before they spiral. If a specific brand is consistently over budget because of packaging inefficiencies, ingredient waste, or poor yields, visibility into those numbers allows you to dig into the root causes and correct the course quickly.
Viewing your COGS by time period allows you to recognize seasonal shifts or supply chain changes that may impact your costs. With raw material costs changing more quickly than ever, the sooner you can see changes coming and respond, the more money you’ll be able to bring back into the business to help you continue to thrive.
The Difficulty of Too Much Data
For many breweries, tracking sales and COGS starts with a spreadsheet. And while spreadsheets are flexible and familiar, they come with serious limitations. They’re often manually updated, which increases the chance of errors or outdated numbers. You might be relying on different sheets owned by different team members, with inconsistent formulas or conflicting information. It’s not uncommon for breweries to spend hours compiling reports, only to realize they’ve made a mistake or missed a trend entirely.
Plus, it can feel overwhelming and hard to find real insights with so much data to keep track of. The lack of organization that comes with using spreadsheets can cause owners and managers to get stuck in inaction. After all, if you don’t make a change, it can’t be THAT bad, right?
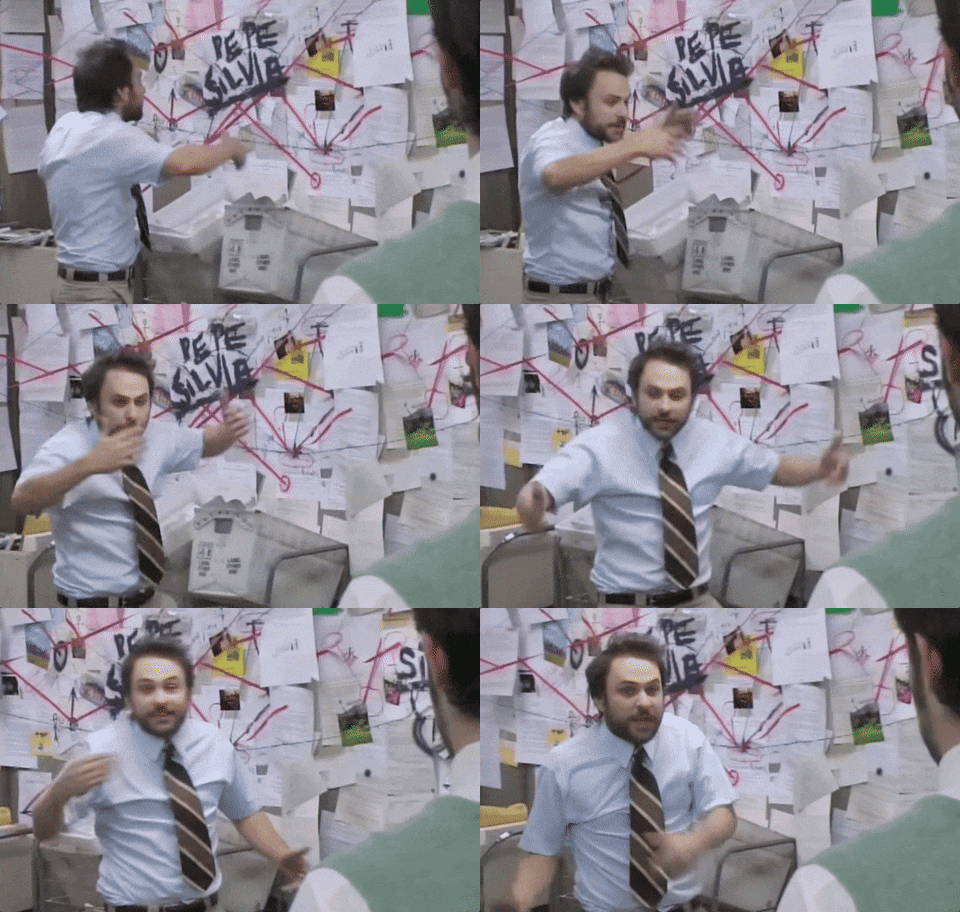
Well, much like the holy trinity of rock and roll, Rush (and maybe some other guy) told us, “If you choose not to decide, you still have made a choice.” So if you’re overwhelmed by your spreadsheets and frantically wasting time trying to connect the dots a la Charlie Day, then why even collect the data?
You need to be able to decipher your data and make actionable decisions (bonus points if you can do that without wasting hours trying to make sense of it all).
This is where brewery management software like Beer30 shines. Beer30’s Command Center is your centralized hub for brewery insights, designed to put everything you need to know about your Sales and COGS in one place, updated in real time, and easy to use.
On the Sales Dashboard, you can see:
This allows you to assess performance from every angle and act quickly on what the data tells you.

On the COGS side, the Command Center gives you:
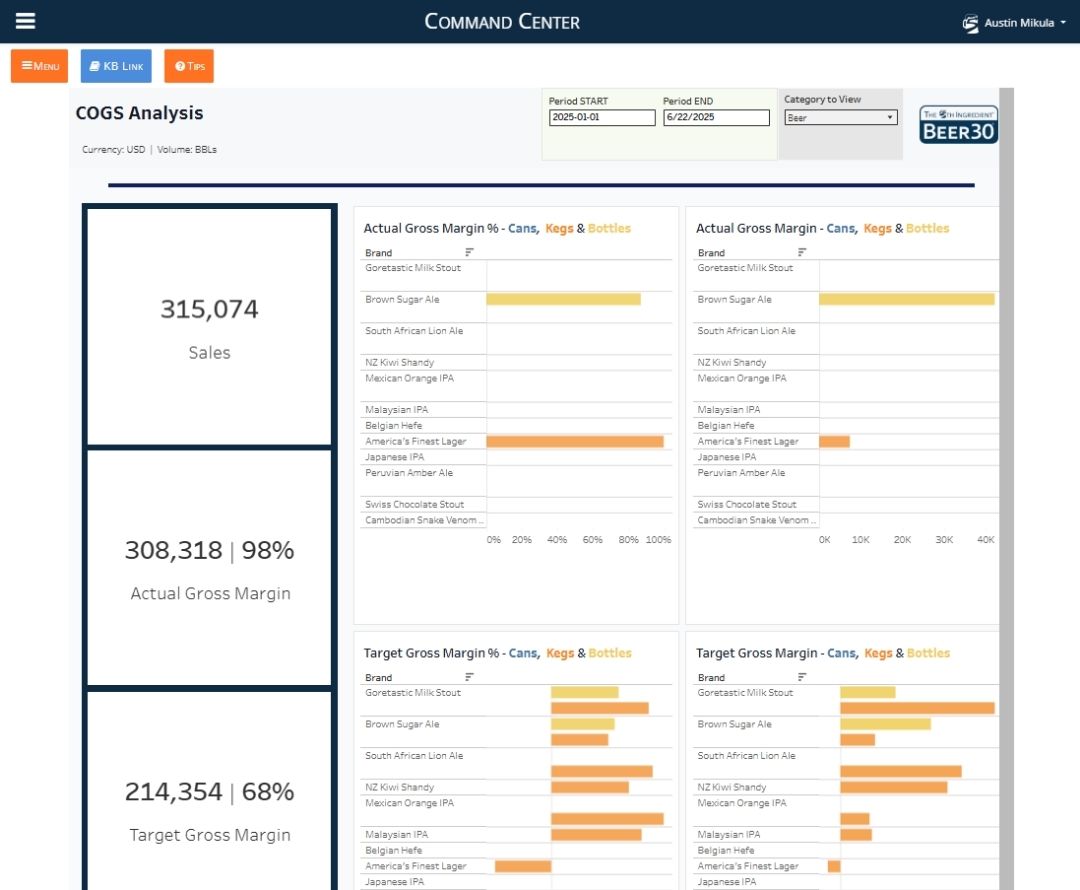
Together, these dashboards remove the guesswork and get you back to actually brewing beer. You’ll know what’s selling, how much it’s costing you, and where you can make small tweaks that drive major results.
At the end of the day, breweries that thrive are the ones that understand their business as deeply as they understand their brewing process. Tracking sales and COGS isn’t just good practice; it’s a competitive advantage that has become a necessity in a challenging market.
With Beer30’s Command Center, it’s never been easier to stay informed and in control.
Explore our Pricing & Features to find the Beer30 package that fits your brewery.

